 DONNOK
Watch compound growth tick every second: DONNOK’s My investment board
Enter a principal and annual return to see a compound growth estimate rise every second: setup, formula, a 10 million won at 5% example and its limits.
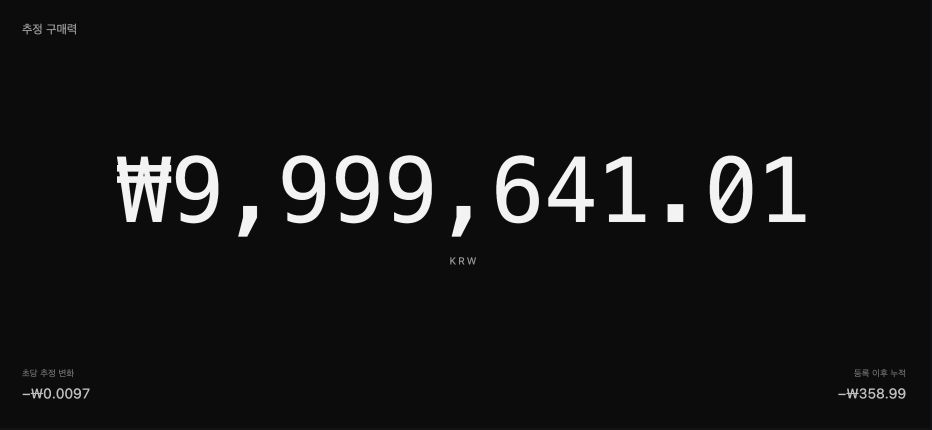
What does the My investment board show?
The large number is the estimated value right now. Below it you see the estimated gain per second and the gain since you started, and the applied annual return appears at the bottom. The board uses the digit style of the theme you selected.
This board does not use the money registered in My funds. While the My display board shows purchasing power shrinking with inflation, this one shows a separate scenario where money grows.
How do I set it up?
One setup is saved for each currency. Applying again discards the previous start time and calculates from that moment.
- In the Display tab, tap the board name (▼) at the top to open the list.
- Select My investment.
- Enter the principal (up to 9,999,999,999) and the annual return (0–999%) in the fields that appear.
- Tap Apply and start. The number begins rising every second.
How is the estimated value calculated?
Estimated value = principal × (1 + annual return)^(elapsed time ÷ 365 days). After one year the value has grown by exactly the annual return, and the time in between is filled in smoothly at the same rate. Because each year’s result becomes the next year’s starting amount, the growth compounds.
Estimated gain per second = current value × ln(1 + annual return) ÷ 31,536,000 seconds. As the value grows, the gain per second also grows slowly.
| Elapsed time | Estimated value | Gain per second |
|---|---|---|
| Start | 10,000,000 won | About 0.0155 won |
| 1 day | About 10,001,337 won | About 0.0155 won |
| 1 year | 10,500,000 won | About 0.0162 won |
| 5 years | About 12,762,816 won | About 0.0197 won |
| 10 years | About 16,288,946 won | About 0.0252 won |
How is this different from a real investment?
The board uses one principal and a fixed annual return. It does not include monthly contributions, changing returns, taxes, fees or the possibility of losses, and it does not connect to any bank or brokerage account.
The value shown is nominal. If prices rise over the same period, the real purchasing power is lower. To weigh returns against inflation, use the future purchasing power calculator together with the note comparing interest and inflation.
There is no correct annual return to enter. Use a number whose basis you understand, such as a deposit rate or your own target, and try several values to feel the difference. DONNOK does not recommend any product or rate.